Basic Usage
Prerequisite: Getting Started
Running a Simulation with First-Claimed Greedy Algorithm
Consider the following configuration file:
decision_making:
  plugin: plugins.greedy.greedy.FirstClaimGreedy
  FirstClaimGreedy:
    mode: MinDist
    weight_factor_cost: 10000.0 # Only used for `MaxUtil` mode

agents:
  behavior_tree_xml: default_bt.xml
  quantity: 10
  locations:
    x_min: 0
    x_max: 1400
    y_min: 0
    y_max: 1000
    non_overlap_radius: 0
  max_speed: 0.25
  max_accel: 0.05
  max_angular_speed: 0.25
  target_approaching_radius: 50
  work_rate: 1
  communication_radius: 500
  situation_awareness_radius: 500
  random_exploration_duration: 1000.0

tasks:
  quantity: 100
  locations:
    x_min: 0
    x_max: 1400
    y_min: 0
    y_max: 1000
    non_overlap_radius: 0
  threshold_done_by_arrival: 10.0
  amounts:
    min: 6.0
    max: 60.0
  dynamic_task_generation:
    enabled: True
    interval_seconds: 2000
    max_generations: 3
    tasks_per_generation: 25

simulation:
  sampling_freq: 1.0
  speed_up_factor: 0
  max_simulation_time: 0
  agent_track_size: 400
  screen_width: 1400
  screen_height: 1000
  gif_recording_fps: 0.05
  task_visualisation_factor: 3
  profiling_mode: False
  rendering_mode: Screen
  rendering_options:
    agent_tail: True
    agent_communication_topology: True
    agent_situation_awareness_circle: False
    agent_id: True
    agent_work_done: True
    agent_assigned_task_id: True
    agent_path_to_assigned_tasks: True
    task_id: False
  saving_options:
    output_folder: output
    with_date_subfolder: True
    save_gif: False
    save_timewise_result_csv: True
    save_agentwise_result_csv: True
    save_config_yaml: True
This configuration file is the example described in the First-Claimed Greedy section. It demonstrates task allocation using the First-Claimed Greedy algorithm for a scenario with 10 agents and 175 tasks (initially 100 tasks, with 25 additional tasks generated every 1000 simulation-time seconds for a total of 3 times).
Save this configuration file as config_greedy.yaml, and then execute the following command to run a simulation:
python main.py --config=config_greedy.yaml
Then, you will see a simulation similar to the following.
See the configuration file used for the above simulation: config_greedy.yaml.
Understanding Results
Results Structure
After running the simulation, the results will be saved in the output/<YYYY-MM-DD>/ folder, as specified by the following settings:
saving_options:
  output_folder: output
  with_date_subfolder: True
Within this folder, you will find result files with names that start with FirstClaimGreedy_a10_t100_YYYY-MM-DD-HH-MM-SS_......
The current naming convention for these result files is as follows:
<decision_making_plugin_classname>_<agents_number>_<initial_tasks_number>_<timestamp>...
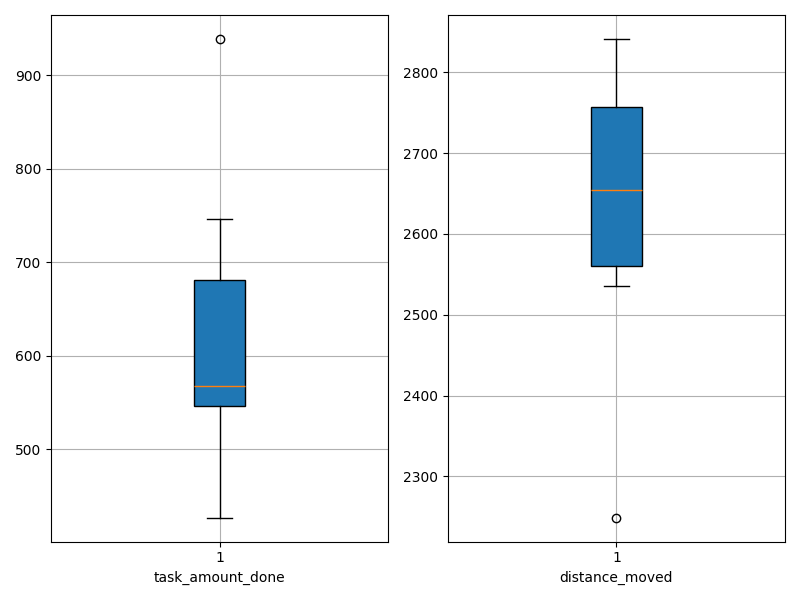
Agent-wise Results
Let’s review the results. Some of the key metrics include:
task_amount_done: The total workload completed by each agent by the end of the mission.
distance_moved: The total distance traveled by each agent by the end of the mission.
These metrics are saved in agent-wise CSV and PNG files as follows:
agent_id,task_amount_done,distance_moved
0,695.0,2093.5391205539554
1,386.0,2356.549635838099
2,510.0,2049.837283938524
3,626.0,2074.72174716173
4,822.0,2013.008940054177
5,765.0,1949.9274451997403
6,545.0,2113.0486784353293
7,544.0,2100.4367186507016
8,366.0,2226.4562712002626
9,556.0,2175.068515125262
|
|
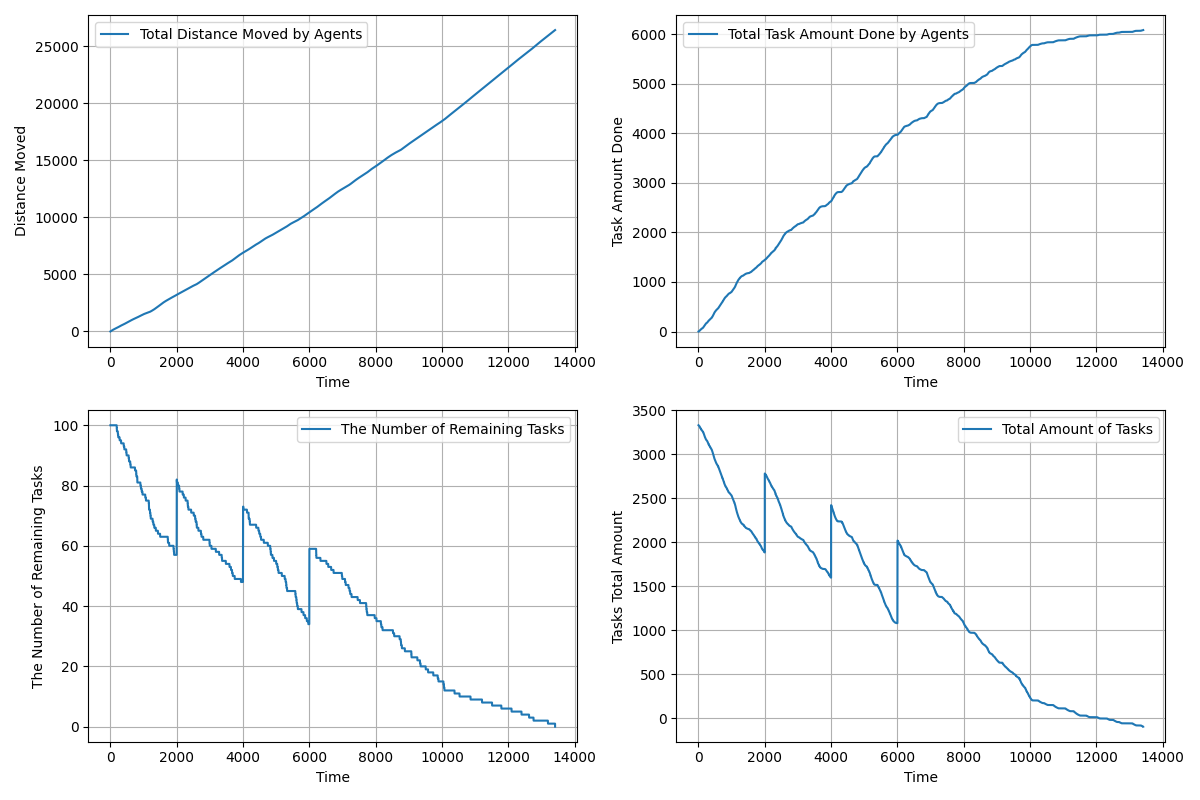
Time-wise Results
We also have time-wise results as follows:
time: The simulation time (not real-time). Since
sampling_freqis set to1in this configuration, records are made every 1 simulation-time second.agents_total_distance_moved: The total distance traveled by all agents up to that time.
agents_total_task_amount_done: The total workload completed by all agents up to that time.
remaining_tasks: The number of tasks still pending at that time.
tasks_total_amount_left: The total remaining workload of all pending tasks at that time.
These results are saved in time-series CSV and PNG files as follows:
time,agents_total_distance_moved,agents_total_task_amount_done,remaining_tasks,tasks_total_amount_left
1.0,0.5,0.0,100,3299.061134356513
2.0,1.1075933286582644,0.0,100,3299.061134356513
3.0,2.048417355743893,0.0,100,3299.061134356513
4.0,2.7930712803981876,0.0,100,3299.061134356513
5.0,3.708385181021291,0.0,100,3299.061134356513
.....
|
|
You can later use the above CSV files for Monte Carlo analysis. For more details, refer to the Conducting Monte Carlo Tests section.
Configuration File
Additionally, because save_config_yaml: True is set, the configuration file used for this simulation is also saved in the output folder for backup purpose.